Learn how to read a safety valve back-pressure curve, verify the pressure basis, interpret correction factors, and know when manufacturer review is needed.

To read a safety valve back-pressure curve correctly, first identify what the graph represents and how it defines the pressure ratio. Then confirm that the curve matches the valve, service, and stated operating basis before locating your point. A correction factor read from the graph is not, by itself, proof that the valve is acceptable for the complete duty.
That distinction matters because manufacturers publish different back-pressure-related curves. One may return a capacity correction factor; another may describe a product-specific operating relationship or limit. Even two correction curves can use different pressure definitions.
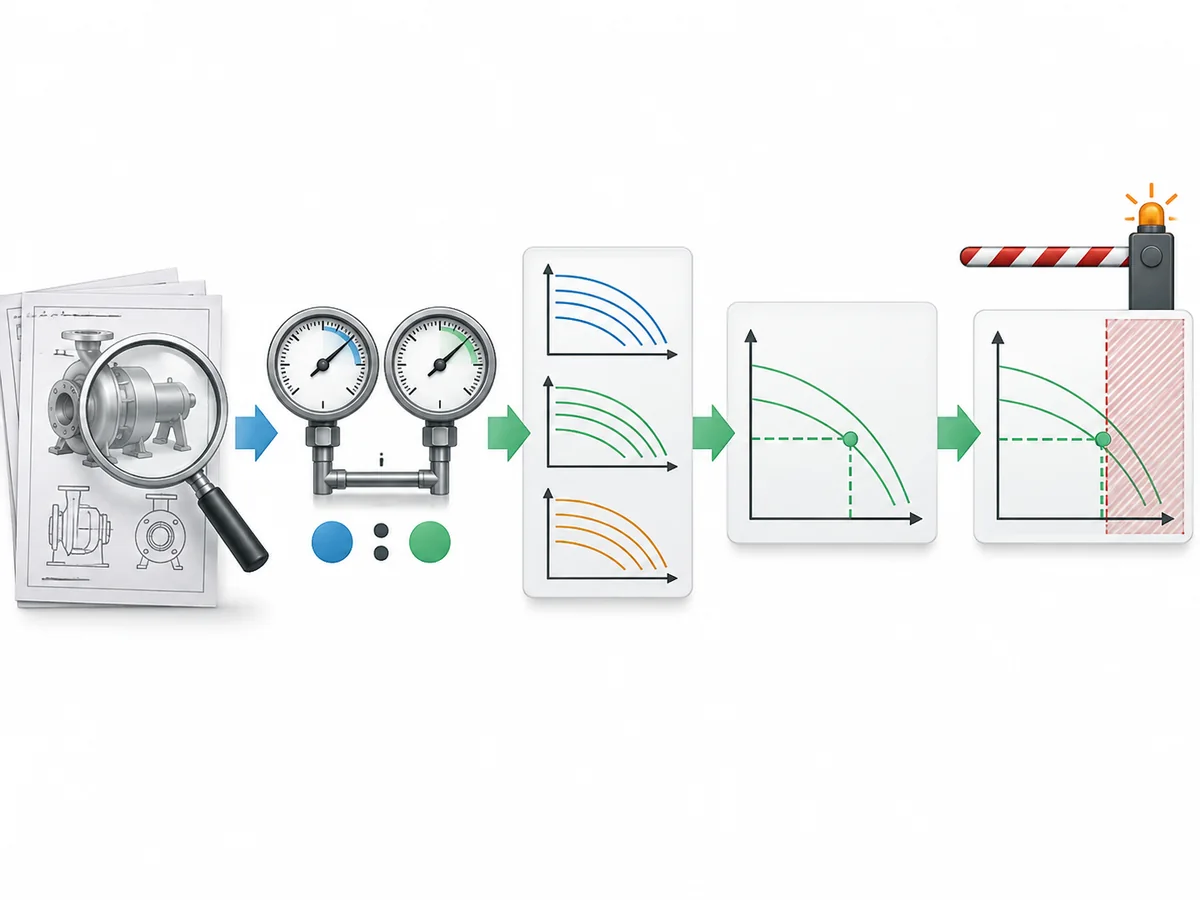
Identify the curve → decode its pressure basis → confirm applicability → locate the operating point → interpret the result → verify what the result does and does not establish.
A point plotted correctly on the wrong curve is still the wrong engineering answer.
What Kind of Back-Pressure Curve Are You Reading?
Do not begin with the percentage on the horizontal axis. Begin with the graph title, legend, valve family, service, and the definition of its output.
Manufacturer engineering literature does not use one universal graph format for every back-pressure question. Emerson’s Pressure Relief Valve Engineering Handbook, for example, publishes separate correction-factor information for different valve configurations and service conditions. That is enough reason not to treat every graph labeled with “back pressure” as interchangeable.
A practical way to classify the graph is by the question it answers:
| Graph output | What the graph can help determine |
|---|---|
| Capacity correction factor | How the documented sizing or capacity relationship changes under the stated back-pressure condition. |
| Product-specific performance relationship | How a particular valve family behaves within the manufacturer’s defined scope. |
| Permissible operating boundary | Whether a stated operating condition falls within a manufacturer-defined boundary. |
These are reading categories, not an official universal classification. A manufacturer may use different terminology.
The common mistake is to see “back pressure” on a chart and immediately interpret the curve as the maximum back pressure the valve can tolerate. That conclusion is valid only when the manufacturer actually defines the graph that way.
So before reading any value from the curve, answer one question: What exactly does the Y-axis value mean?
If that is unclear, the graph is not ready to be used.
Read the Axes, Units, and Pressure Basis Before Plotting a Point
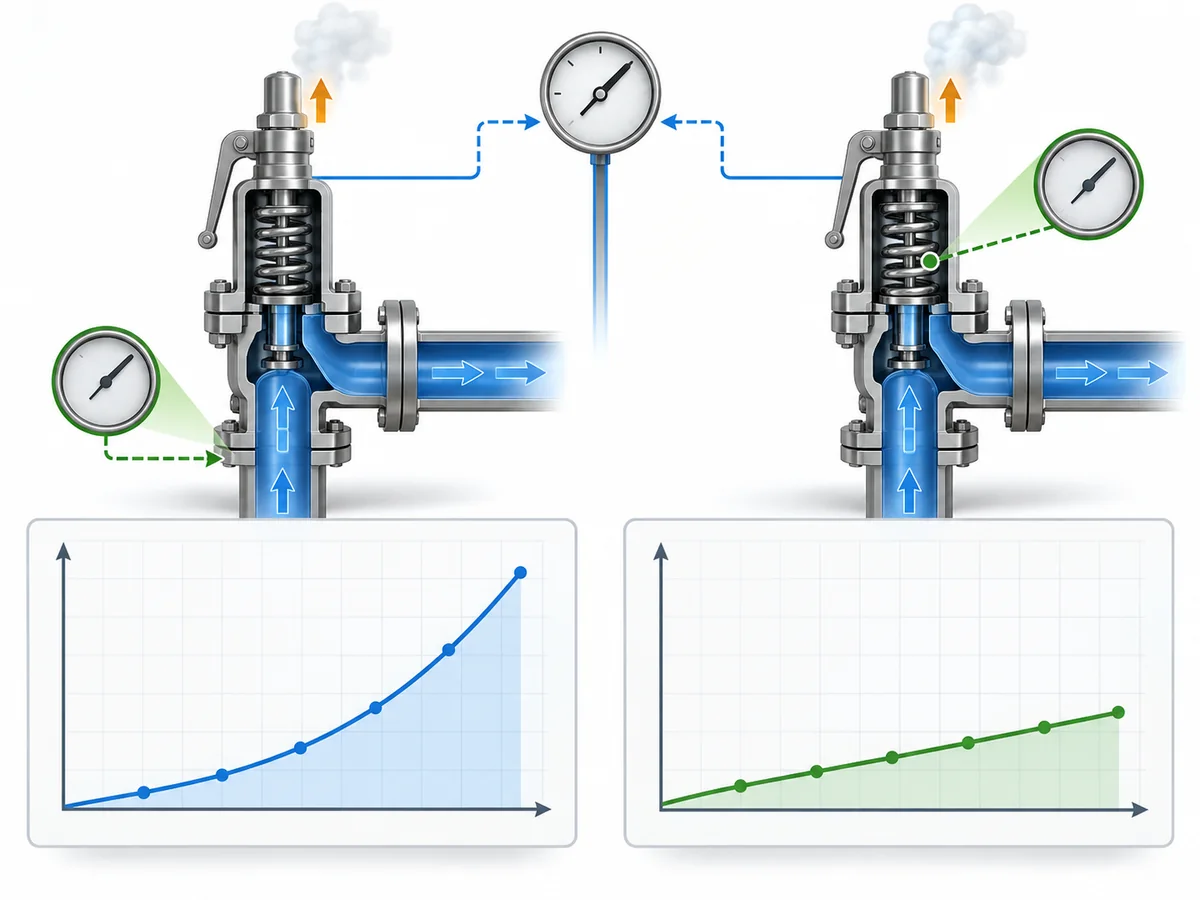
The most consequential detail on many safety valve back-pressure curves is not the shape of the line. It is the definition of the pressure ratio used to reach that line.
Manufacturer engineering documentation illustrates why this matters. Different correction curves can use different pressure relationships: one may relate outlet pressure to relieving pressure on an absolute basis, while another may relate total back pressure to set pressure on a gauge basis. The two graphs may both appear to show a “back-pressure percentage,” but the underlying input is not necessarily the same.
Before calculating or plotting anything, read the graph in this order:
- Curve title and valve family. Identify the product, architecture, or method the graph belongs to.
- Service or phase. Check whether the graph applies to gas, steam, liquid, or another stated service.
- X-axis definition. Record the exact numerator and denominator.
- Pressure basis. Check whether the stated pressures are gauge, absolute, or otherwise specifically defined.
- Y-axis definition. Determine whether the output is a correction factor, another performance variable, or a limit.
- Curve family or legend. If several plotted lines appear, identify what determines the correct one.
- Overpressure or other stated assumptions. Some correction curves are published for a defined operating basis.
- Footnotes and exclusions. Read them before treating the plotted point as applicable.
The denominator is particularly easy to overlook.
If one graph defines its ratio using relieving absolute pressure, replacing that denominator with set gauge pressure because another graph used that convention changes the input itself. The correct rule is therefore not:
“Back-pressure percentage always equals back pressure divided by set pressure.”
The correct rule is:
Use the pressure ratio defined by the specific curve you are reading.
That keeps the interpretation consistent with the document and prevents a familiar-looking percentage from hiding a different engineering basis.
Confirm the Curve Applies to Your Valve and Service
Reading the axes correctly is only half of the job. The next question is whether the graph is actually applicable to the valve and duty being reviewed.
At minimum, check:
| Applicability check | Question to answer before using the curve |
|---|---|
| Valve construction | Was the curve published for the same type of valve? |
| Product scope | Does it apply to this model, series, or documented engineering method? |
| Fluid or phase | Is the graph for gas, steam, liquid, or the actual service involved? |
| Back-pressure condition | Does the documentation address the condition present in the system? |
| Pressure / overpressure basis | Does the application’s basis match the graph’s stated basis? |
| Manufacturer notes | Are there additional exclusions or application limits outside the graph itself? |
The back-pressure condition also needs to be named correctly. Baker Hughes’ Consolidated safety-valve manual distinguishes superimposed back pressure, which exists in the discharge system before the valve opens, from built-up back pressure, which develops at the valve outlet as flow is discharged. Superimposed back pressure may be constant or variable.
For the broader engineering explanation of these mechanisms and their relationship to valve architecture, see ZOBAI’s Back Pressure and Bellows engineering guide.
Balanced-bellows valves illustrate why applicability matters. “Balanced” should not be interpreted as “back pressure can be ignored.” Manufacturer engineering documentation still provides back-pressure correction information for balanced direct-spring valve configurations.
If the application is specifically being screened for that architecture, ZOBAI’s bellows balanced safety valves page is the appropriate product-family next step.
The same evidence boundary applies across manufacturers. An Emerson, Baker Hughes, or other manufacturer’s graph can teach a reading method, but its numerical values cannot be transferred to an unrelated ZOBAI model unless applicable ZOBAI product documentation independently confirms them.
Locate the Operating Point and Interpret the Curve Result
Once the curve has passed the identity, pressure-basis, and applicability checks, the actual reading process becomes much simpler.
First, calculate only the input that the graph defines. Do not substitute a pressure ratio remembered from another handbook.
Second, select the applicable curve family or plotted line. Resolve any valve-series, service, overpressure, or other legend variable before reading the output.
Third, locate the required X-axis value and trace it to the correct curve.
Fourth, read the corresponding Y-axis value.
Then name that result exactly as the source names it. If the graph calls the output a back-pressure capacity correction factor, keep it a capacity correction factor. Do not silently relabel it as an allowable back-pressure percentage.
A Worked Curve-Reading Example
Emerson Birkett’s technical data provides a useful manufacturer-specific example for a balanced-bellows safety relief valve in liquid service.
In the published example:
- set pressure = 150 psig;
- back pressure = 45 psig;
- the source defines the required ratio as back pressure divided by set pressure;
- the ratio is therefore 30%;
- the applicable graph returns Fl = 0.88.
The important lesson is not the value 0.88. It is the sequence:
read the source definition → calculate the source-defined ratio → select the applicable curve → read the defined output.
Those numbers belong to that Birkett graph and its stated conditions. They are not a universal safety-valve rule and are not ZOBAI product-performance data.
The example is therefore useful as a reading method, not as a reusable selection table.
Do not assume a universal interpolation method; follow the instructions for the specific manufacturer curve. If the required condition lies beyond the published range and the documentation gives no extension method, do not invent an extrapolated factor. Verify the applicable manufacturer data instead.
A Correction Factor Is Not the Same as an Allowable Back-Pressure Limit
A correction factor answers a narrower engineering question than valve acceptance.
A correction-factor curve can answer:
What factor applies to the documented sizing or capacity relationship under this back-pressure condition?
It does not automatically answer:
Is this valve design permitted to operate at this back pressure?
And neither answer, by itself, establishes:
Is the complete selected valve suitable for the project relief duty?
Emerson’s pressure-relief engineering guidance treats back-pressure factors such as Kb or Kw as correction factors within defined sizing or capacity methods. A manufacturer’s permissible operating limits remain a separate application check.
Keep the three decisions separate:
| Decision | Evidence required |
|---|---|
| What factor does the curve return? | Correct curve, pressure basis, operating input, and plotted result. |
| Is the valve configuration allowed at this condition? | Applicable manufacturer limits and product documentation. |
| Is the valve suitable for the complete relief duty? | Full service, sizing, configuration, and system review. |
That distinction prevents a common shortcut:
“My point appears on the curve, therefore the valve is acceptable.”
The point may establish that a factor can be read from that graph within its documented scope. It does not turn a capacity correction into complete application approval.
Likewise, a generic percentage such as “X% is always the maximum allowable back pressure” should not replace the actual valve design basis and manufacturer documentation.
When the next task becomes complete valve sizing rather than curve interpretation, continue with ZOBAI’s Safety Valve Sizing and Certified Relieving Capacity Guide.
When the Curve Is Not Enough: Stop Conditions and Verification Inputs
A back-pressure curve is useful only while the information needed to interpret it remains inside the curve’s documented scope.
Stop and verify the missing basis when:
- you cannot determine what the graph represents;
- the X-axis pressure ratio or gauge/absolute basis is unclear;
- the graph belongs to a different valve design, series, or product family;
- the service phase does not match;
- the relevant back-pressure condition has not been identified;
- the stated overpressure or other operating basis does not match the intended use and no alternate method is given;
- the required operating point is outside the published graph and no extension method is provided;
- the question has progressed from reading a factor to approving the valve for the complete duty.
These are practical stop-and-verify conditions for using the curve, not a separate API or regulatory classification.
When manufacturer or engineering review is needed, provide the underlying application data rather than sending only a back-pressure percentage.
| Verification input | Why the reviewer needs it |
|---|---|
| Exact valve design or candidate model | Establishes which technical data applies. |
| Set pressure | May form part of the graph basis and valve selection. |
| Required relieving condition | Defines the actual relief duty. |
| Built-up back pressure | Identifies outlet pressure generated during discharge. |
| Superimposed back pressure | Identifies discharge-side pressure present before opening. |
| Constant or variable superimposed condition | Clarifies the operating condition to be reviewed. |
| Fluid and phase | Determines which sizing or correction method is relevant. |
| Operating and relieving temperature | May affect application and product limits. |
| Applicable overpressure basis | Must be compatible with the technical method being used. |
| Exact curve or manufacturer document | Allows the reviewer to verify the factor and its scope. |
Baker Hughes’ safety-valve technical application data, for example, treats built-up back pressure, superimposed back pressure, allowable overpressure, temperature, valve design, manufacturer, and model as separate specification inputs rather than collapsing the decision into one percentage.
The practical endpoint is therefore not:
“I found the number on the graph.”
It is:
“I know what this number represents, why this curve applies, and which conditions still need verification before the valve is accepted for the duty.”